SABnzbd+ for Status Board
The code in this post has been archived and will not receive any updates. Use at your own risk.
Since making the iStat Server for Status Board script I’ve wanted to make more graphs for Status Board. Lo and behold, I use SABnzbd+ and it has an API. A graph is born:

The above graph collates all the downloads in the queue and counts them up then graphs them out, it’s pretty self explanatory really. Along side those bar graphs is the total of all items in the queue. Also available is a custom “Do-it-yourself” panel with core information about your SABnzbd+ server.

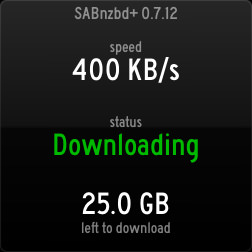
This pane is also pretty self explanatory. At the top you’ve got the version number of SABnzbd+, the current speed of your downloads, the status of the server (i.e. paused, downloading etc), and the size (in GBs) of what’s left to download in the queue. At this point in time, the info pane is only suitable for a 4x4 panel.
Jump over to the GitHub page to take a gander at the code and download it. Getting it set up is pretty easy, but if you’re stuck, I can provide limited support on the GitHub page, or via Twitter.
Please take a look and let me know if you find it useful!