iStat Server Graphs for Status Board (Updated)
The code in this post has been archived and will not receive any updates. Use at your own risk.

Ever since Panic’s Status Board for iPad app came out I’ve wanted to have data from iStat Server appear in Status Board.
After finding that iStat Server stores its data in /Library/Application Support/iStat Server/databases/local.db and that the SQLite database and all its data is not encrypted/obfuscated in any way, I figured it wouldn’t be too difficult to get the juicy data into some sexy Status Board graphs.
Using the PDO and SQLite libraries included with Mac OS X 10.8.3 I was able to get a connection to the database and pull out rows. Simply store this file anywhere on your Mac that’s accessible by the built-in web server.
Lo and behold, a graph is born:

The project is still in its infancy, with only a few different graphs. I plan on slowly adding more and more graphs and types. As of this post, the following graphs are possible:
ram_hour- RAM usage for the past 60 minutesram_day- RAM usage for the past 24 hourscpu_hour- CPU usage for the past 60 minutescpu_day- CPU usage for the past 24 hoursload_hour- CPU load for the past 60 minutesload_day- CPU load for the past 24 hourstemp_hour- Temp sensors for the past 60 minutes *new*
Take a look at the GitHub repo for more details and the download link to get this puppy running. Limited support can be provided on GitHub or on Twitter at @yesdevnull.
Update - 05/06/2013
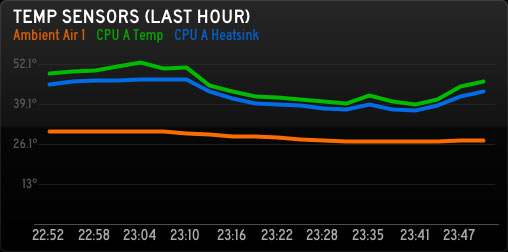
Todays big update includes temp sensor monitoring so you can get more pretty graphs, like below.

If you’re checking 1 sensor, make your query string &temps=TC0D, or for multiple sensors, do &temps=TC0D,TC0H. If you have multiple temp sensors, they must be comma delimited. For the most up-to-date list of sensors, check the README in the GitHub repo.
Head over to the GitHub repo (linked above) to check out the new changes and get it set up on your Mac!