Pingdom for Status Board
The code in this post has been archived and will not receive any updates. Use at your own risk.
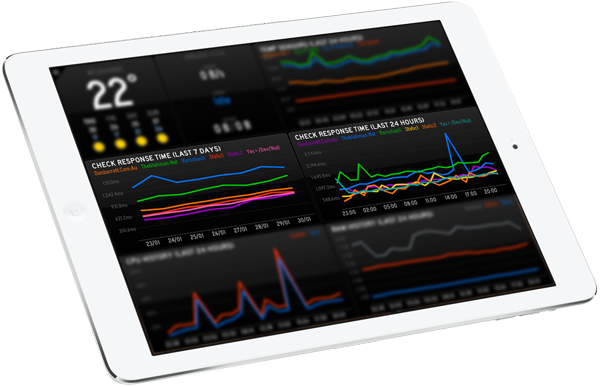
After making my first two Status Board graphs I have been thinking of a third graph to make. Combined with my love for graphs, along with my love for making graphs, my third Status Board graph is a check response time graph for Pingdom.
I use Pingdom to monitor the response times of my servers (d’uh) and I thought I’d like to be able to see those results in a Status Board graph. You merely have to download the code from the GitHub repository, create the config.php file as per the README instructions and you’ll have a fully functional Status Board graph.
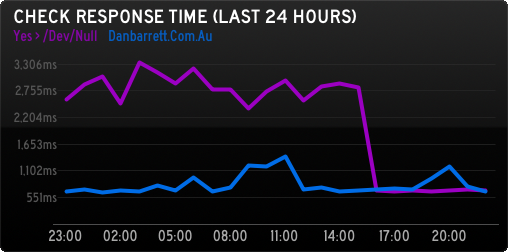
Currently my graph only supports results from the last 7 days, or the last 24 hours. I’m planning on adding more graphs soon, but currently, only these two graphs are super useful (in my opinion). In the config.php file I recommend that if you have less than 6 hosts in your account you can pass the ?autohost=true variable to the query string. Otherwise, if you have more than 6 the graph will probably look pretty messy with loads of lines everywhere.
Note: the graph bugs out a fair bit if, for example, you do a graph of last week but there’s only been less than a week worth of results you’ll see the graph looks a bit silly. It appears that Status Board doesn’t like graph keys that include a / or : (or I presume any other non-numerical characters).